2nd Place
Victoria Tech Night / Hackathon #1
Arena Heat Map Intelligence
Arena Operations
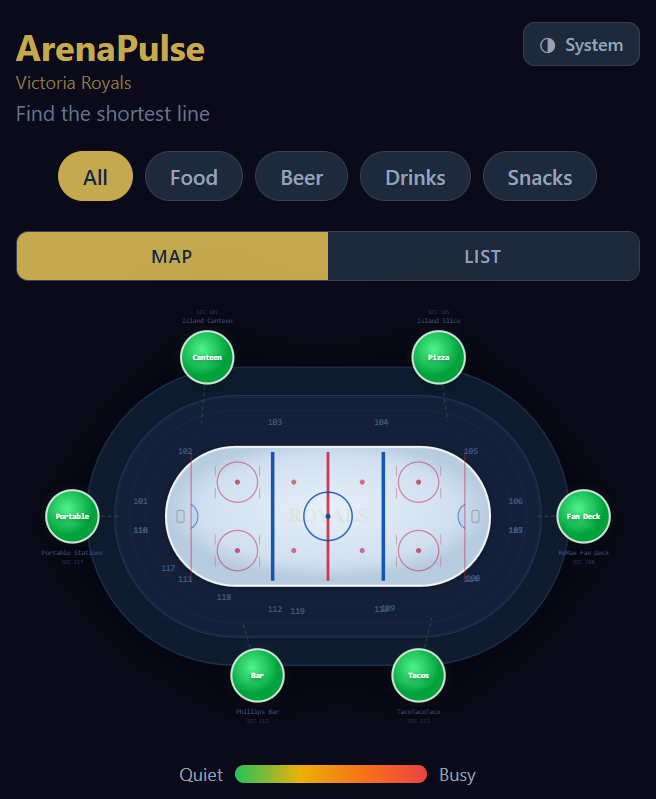
ArenaPulse: Live concession heat map with wait time indicators. Live at royals-hackathon.vercel.app
About this project
Spatial heat map visualization for crowd flow analysis, concession hotspot detection, and real-time foot traffic patterns. Provides a visual layer for understanding where fans go, when they move, and how to optimize arena layout and staffing.
This solution addressed a dimension the winning dashboard did not cover: the spatial element. By mapping foot traffic and congestion patterns, the Royals can make data-driven decisions about concession placement, staffing levels during intermissions, and crowd management protocols.