Royals Analytics Dashboard
Fan Engagement
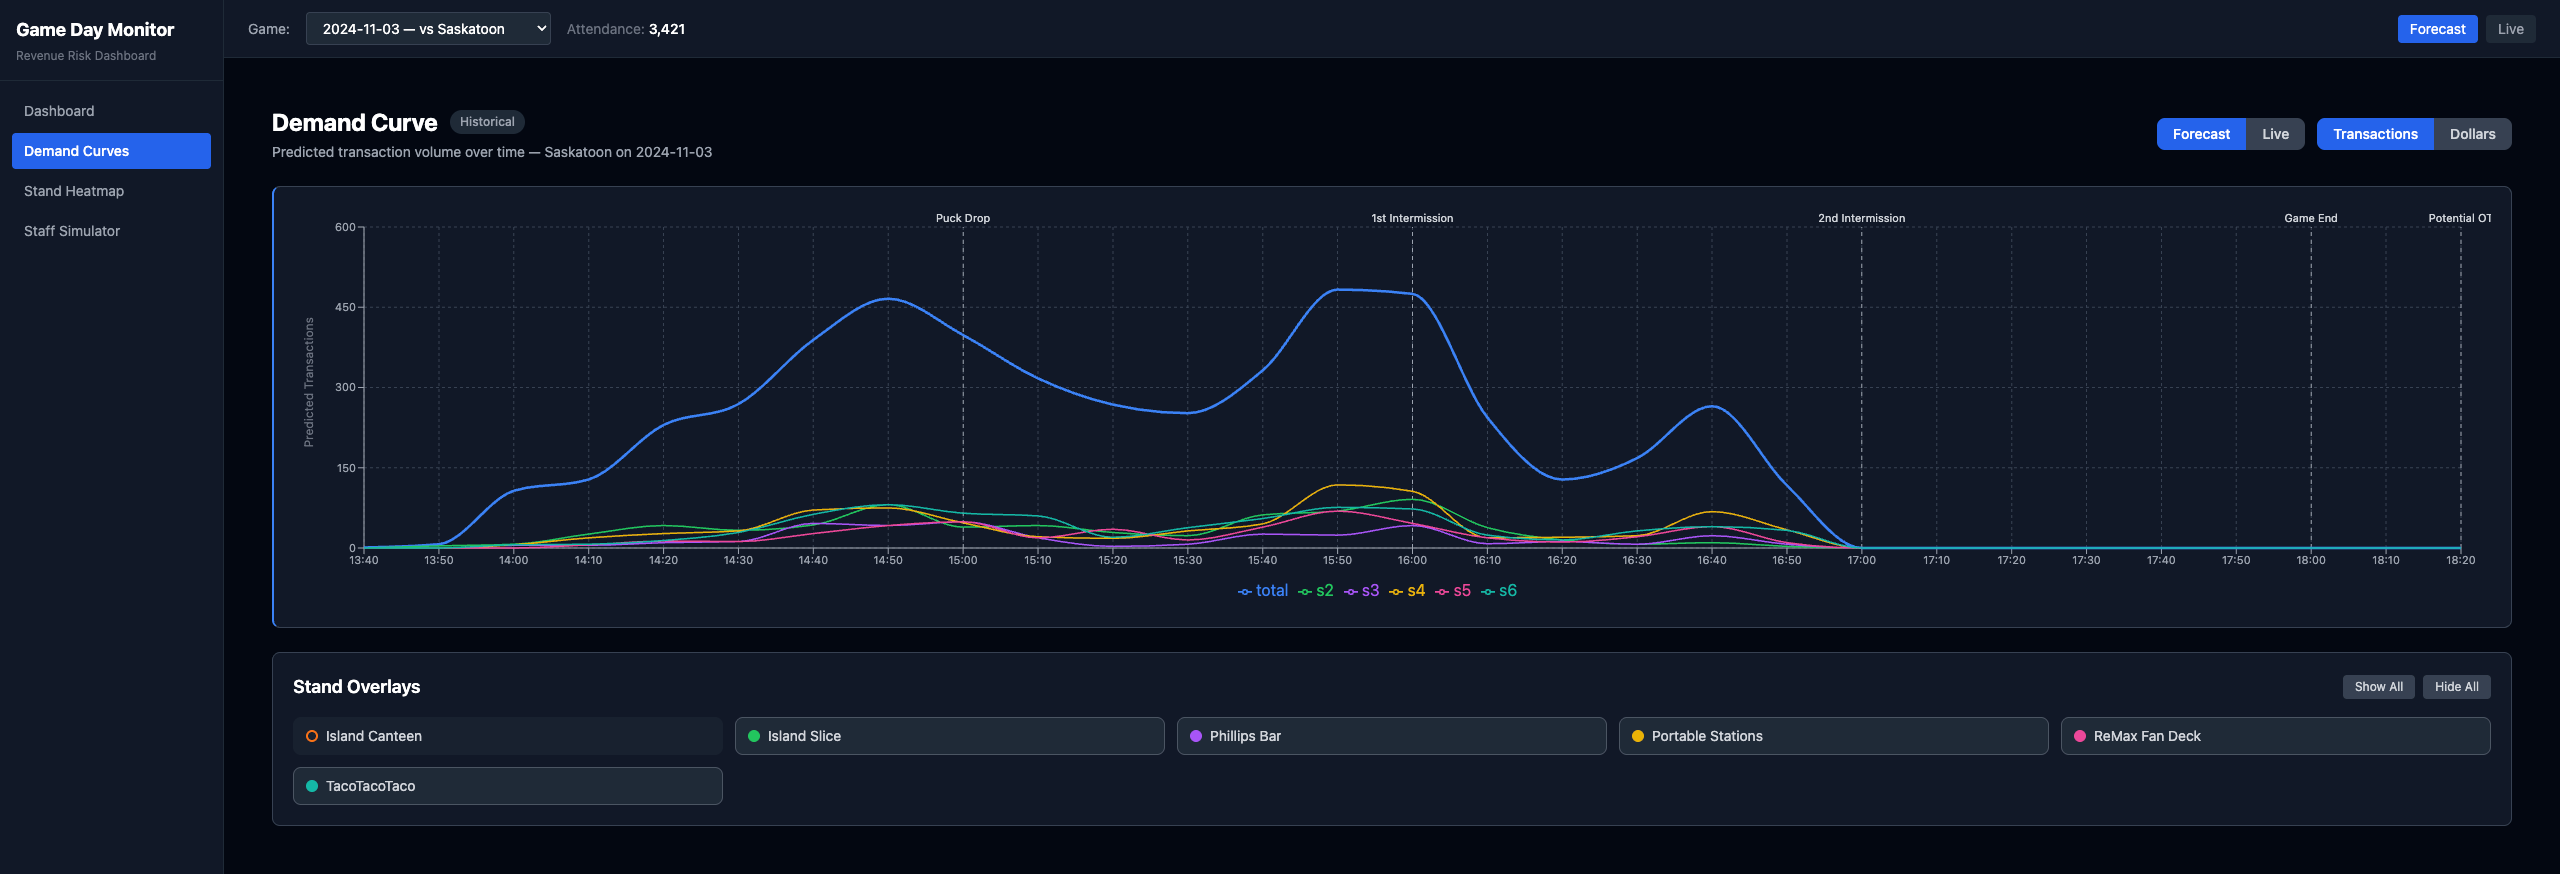
Game Day Monitor: Demand curves, stand overlays, and revenue analytics for game-day operations.
About this project
Comprehensive game-day analytics dashboard with deep operational KPIs, attendance trends, revenue insights, and concession performance tracking. The most polished and feature-complete solution, selected by the Victoria Royals organization as their favorite for level of detail and functionality.
The dashboard provides a visual layer for understanding game-day operations across multiple dimensions: ticket sales trends, concession revenue breakdowns, fan demographic analysis, and real-time attendance tracking. Built to give the Royals front office actionable insights they can use immediately.
Links
No links available yet. Check back soon.